
Protect the short-term.
Build the long-term.
Every organisation has a gap between what it could deliver
and what it actually delivers.
We find what’s causing yours, and what it’s costing you.

An outside-in analysis of your organisation.
We analyse your business the way a serious investor or an incoming chair would, from the outside, using only public information. The report shows where it is strong, where the friction sits, what the gap between potential and delivery is costing each year, and where renewal would begin.
It is written in plain language, as a set of hypotheses to test against what you know from the inside, not as verdicts.


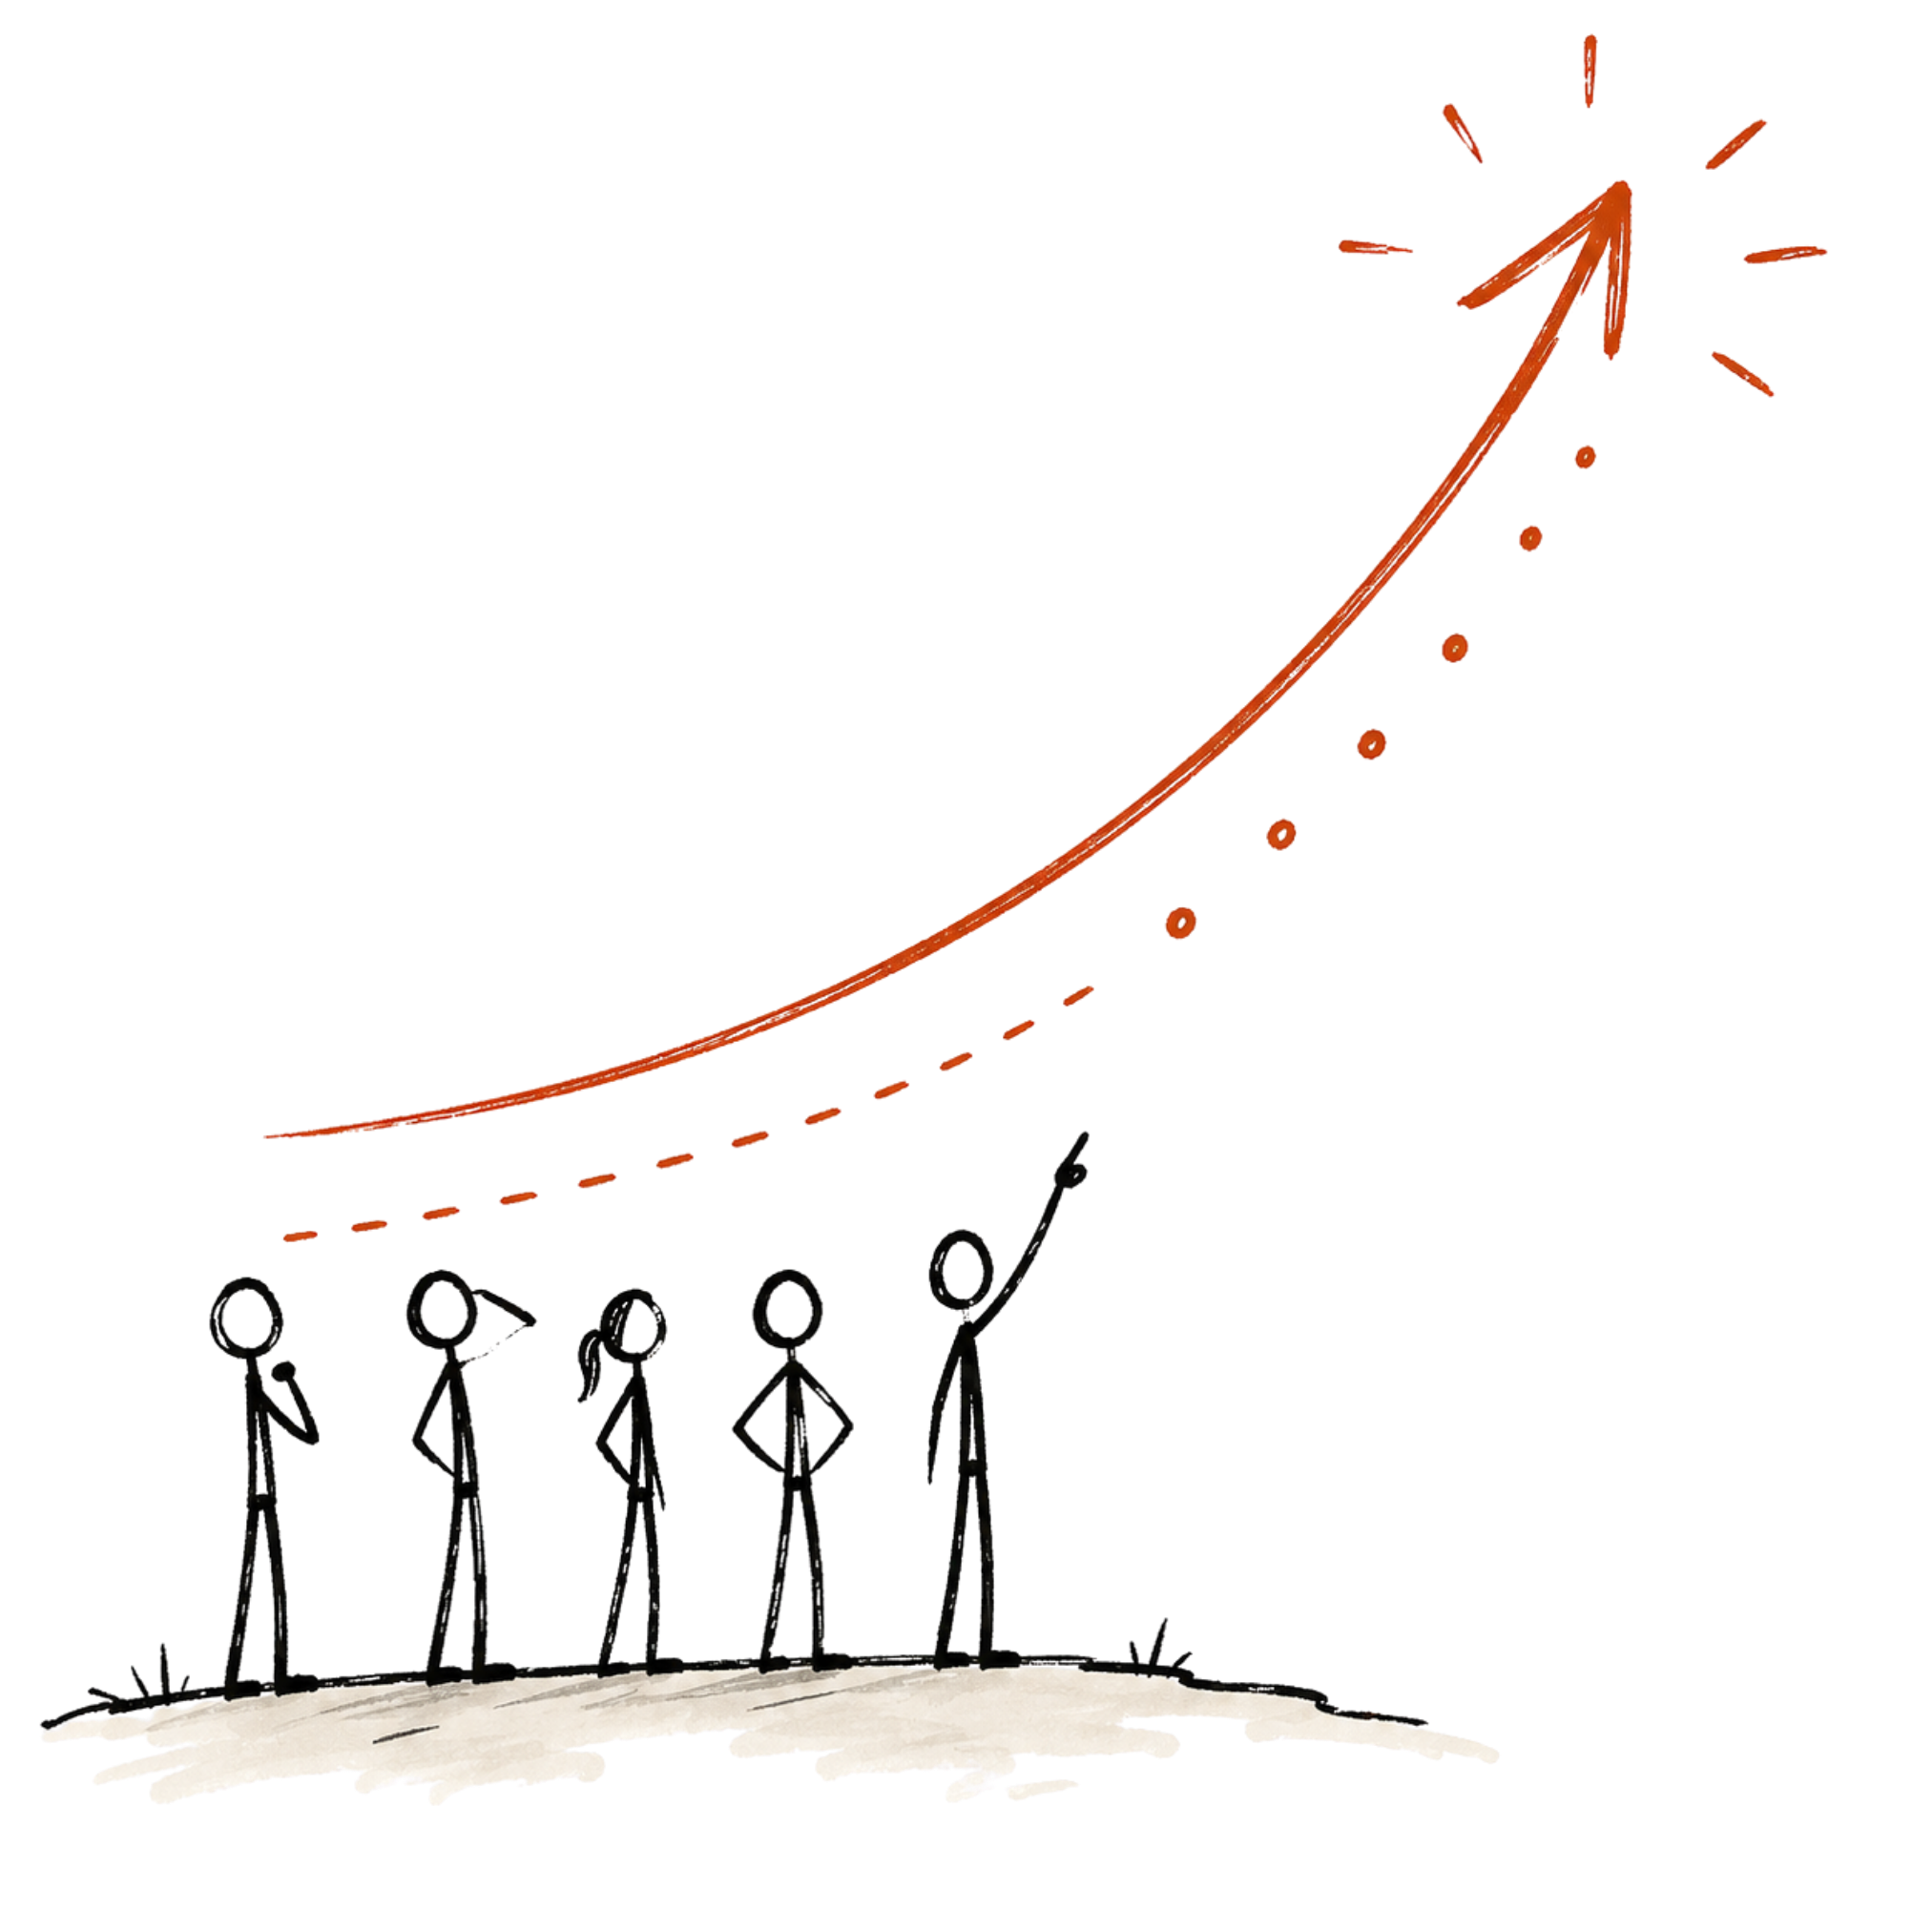
You can hit your numbers and still be losing ground.
Accounts are late signals. They show the outcome of decisions, behaviours and conditions from months or years ago. They were shaped by qualities like trust, decision speed, decision quality, coherence, adaptability and resilience. When these qualities weaken, results can hold, but not indefinitely.
By the time erosion shows up in the numbers, it has already taken root in the business.

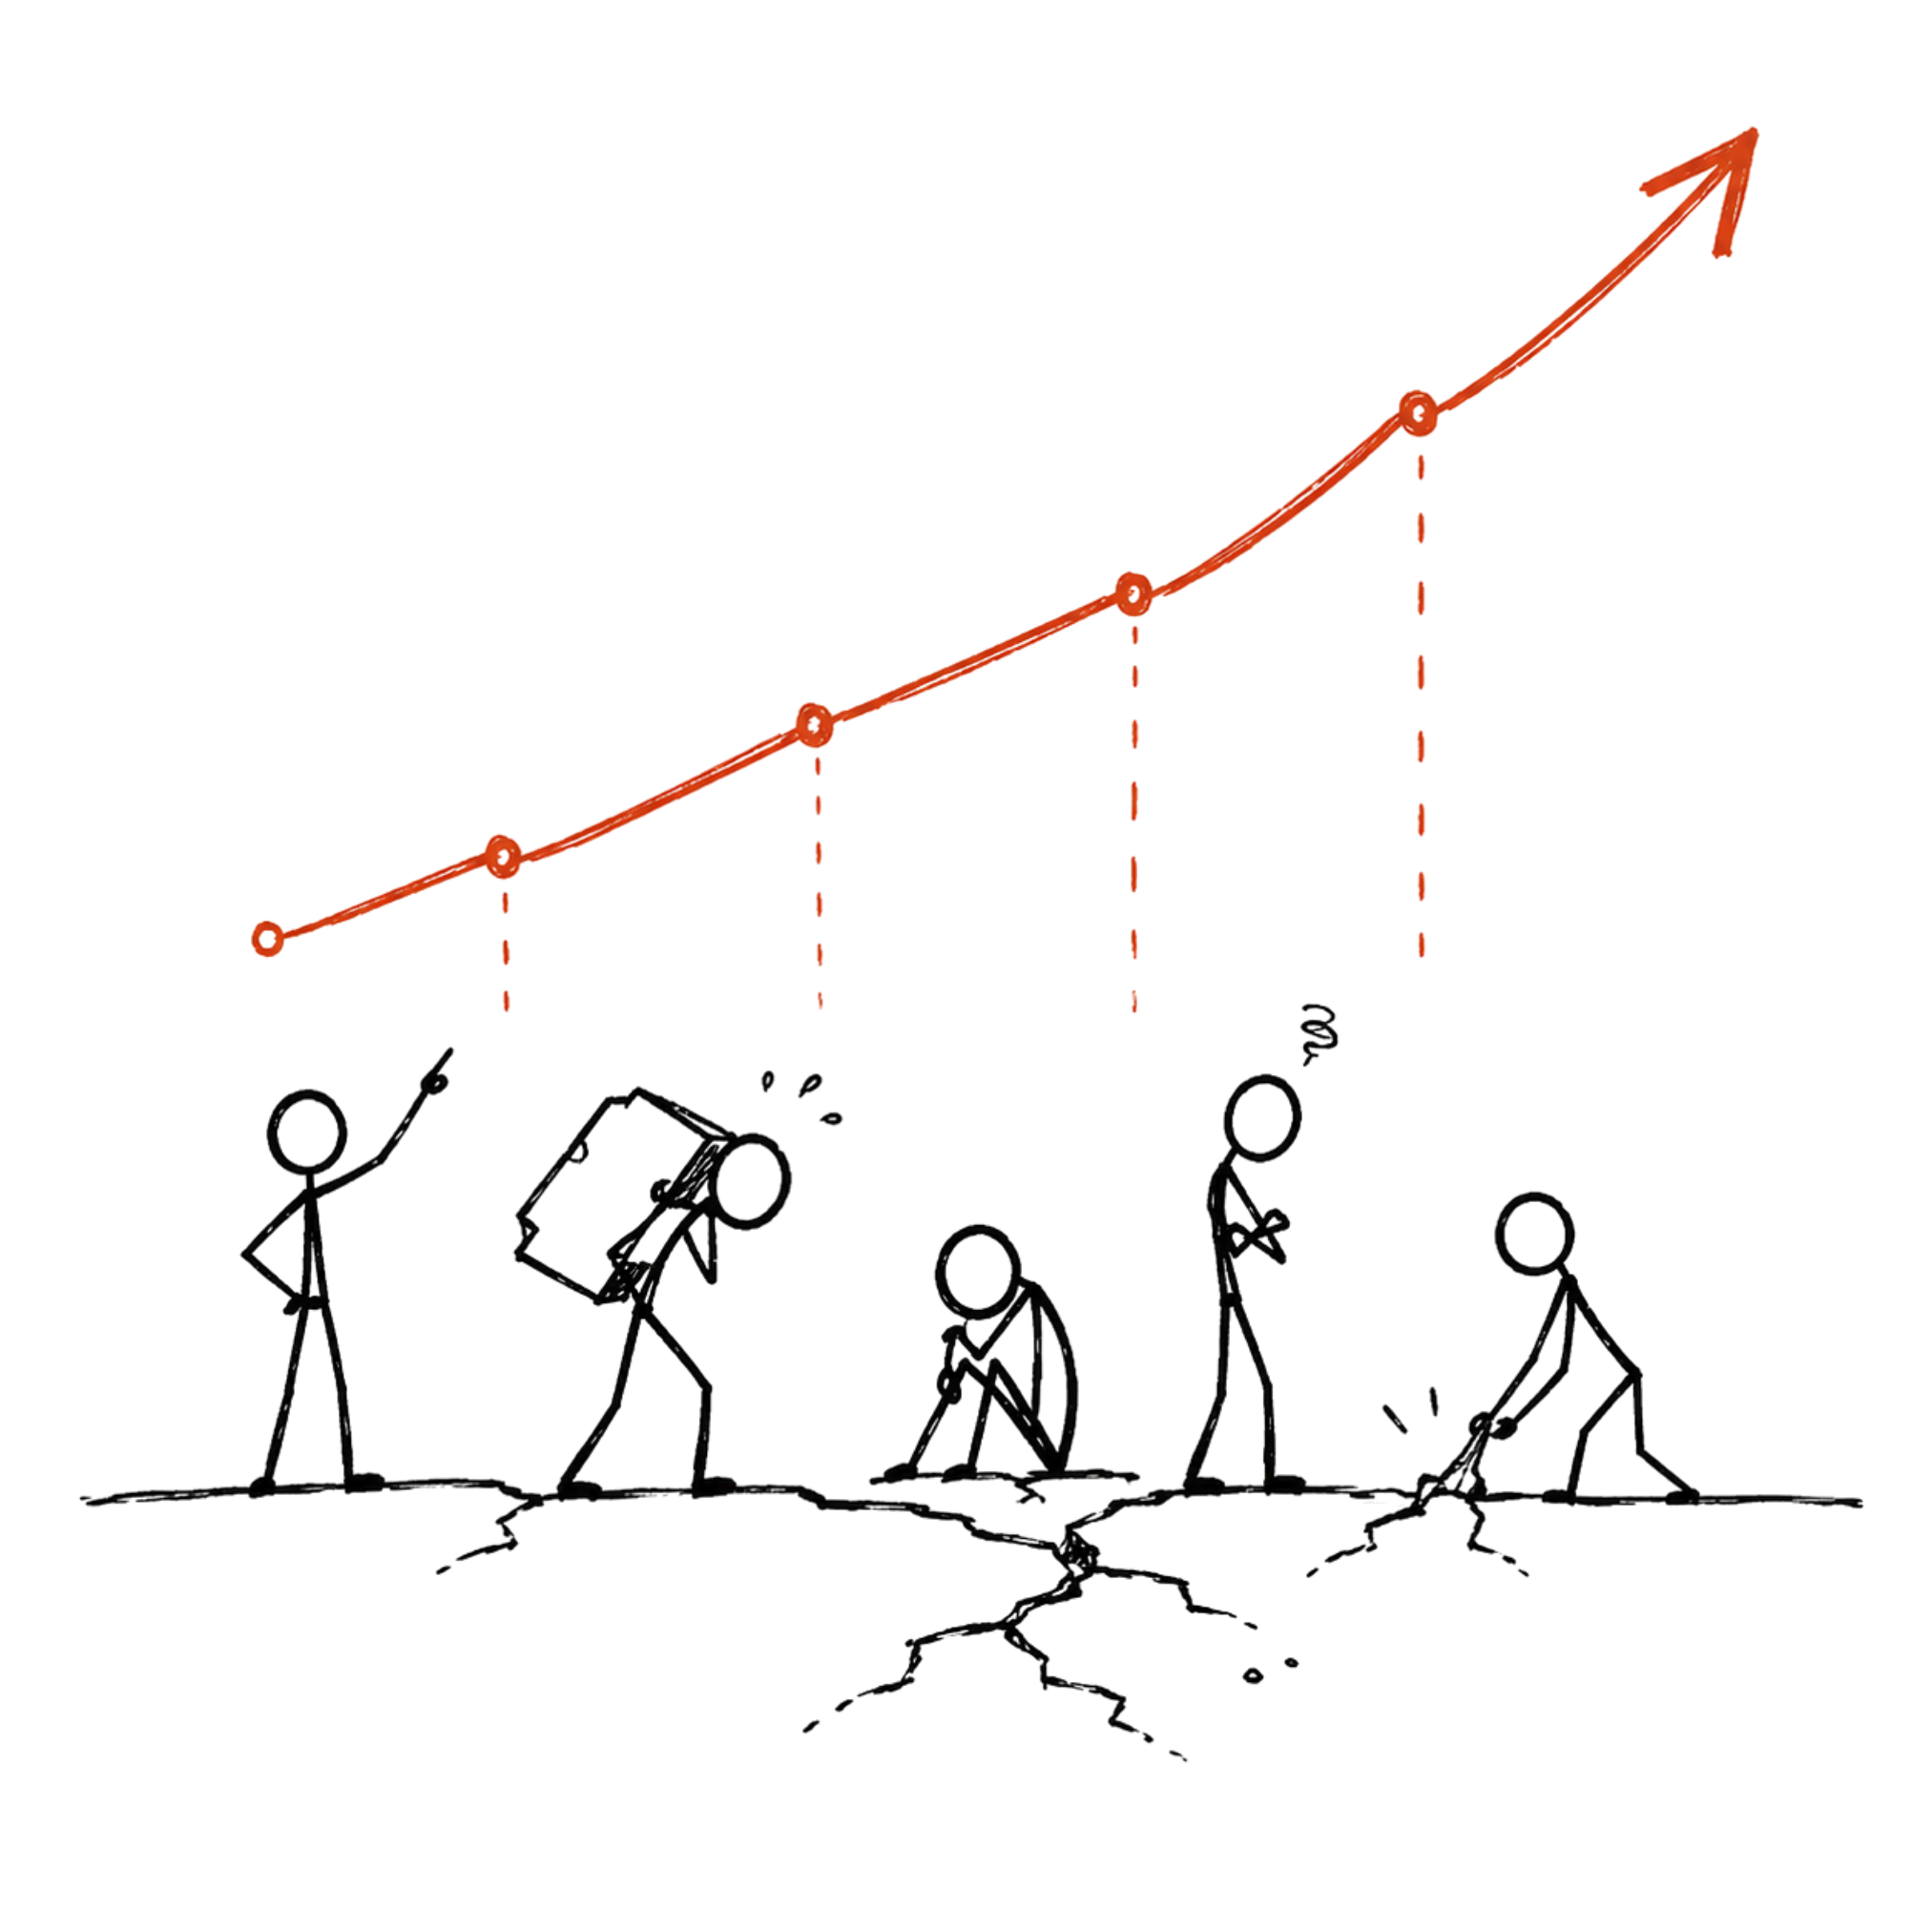
Every business has places where value gets stuck.
Between potential and performance sits organisational friction: the habits, assumptions, logics, silences and ways of working that slow decisions, distort priorities and weaken execution. These logics and assumptions often date back to thinking that helped the business succeed. Now it may be holding value back.
Most organisations have never seen clearly where that friction sits, what it looks like and what it costs.
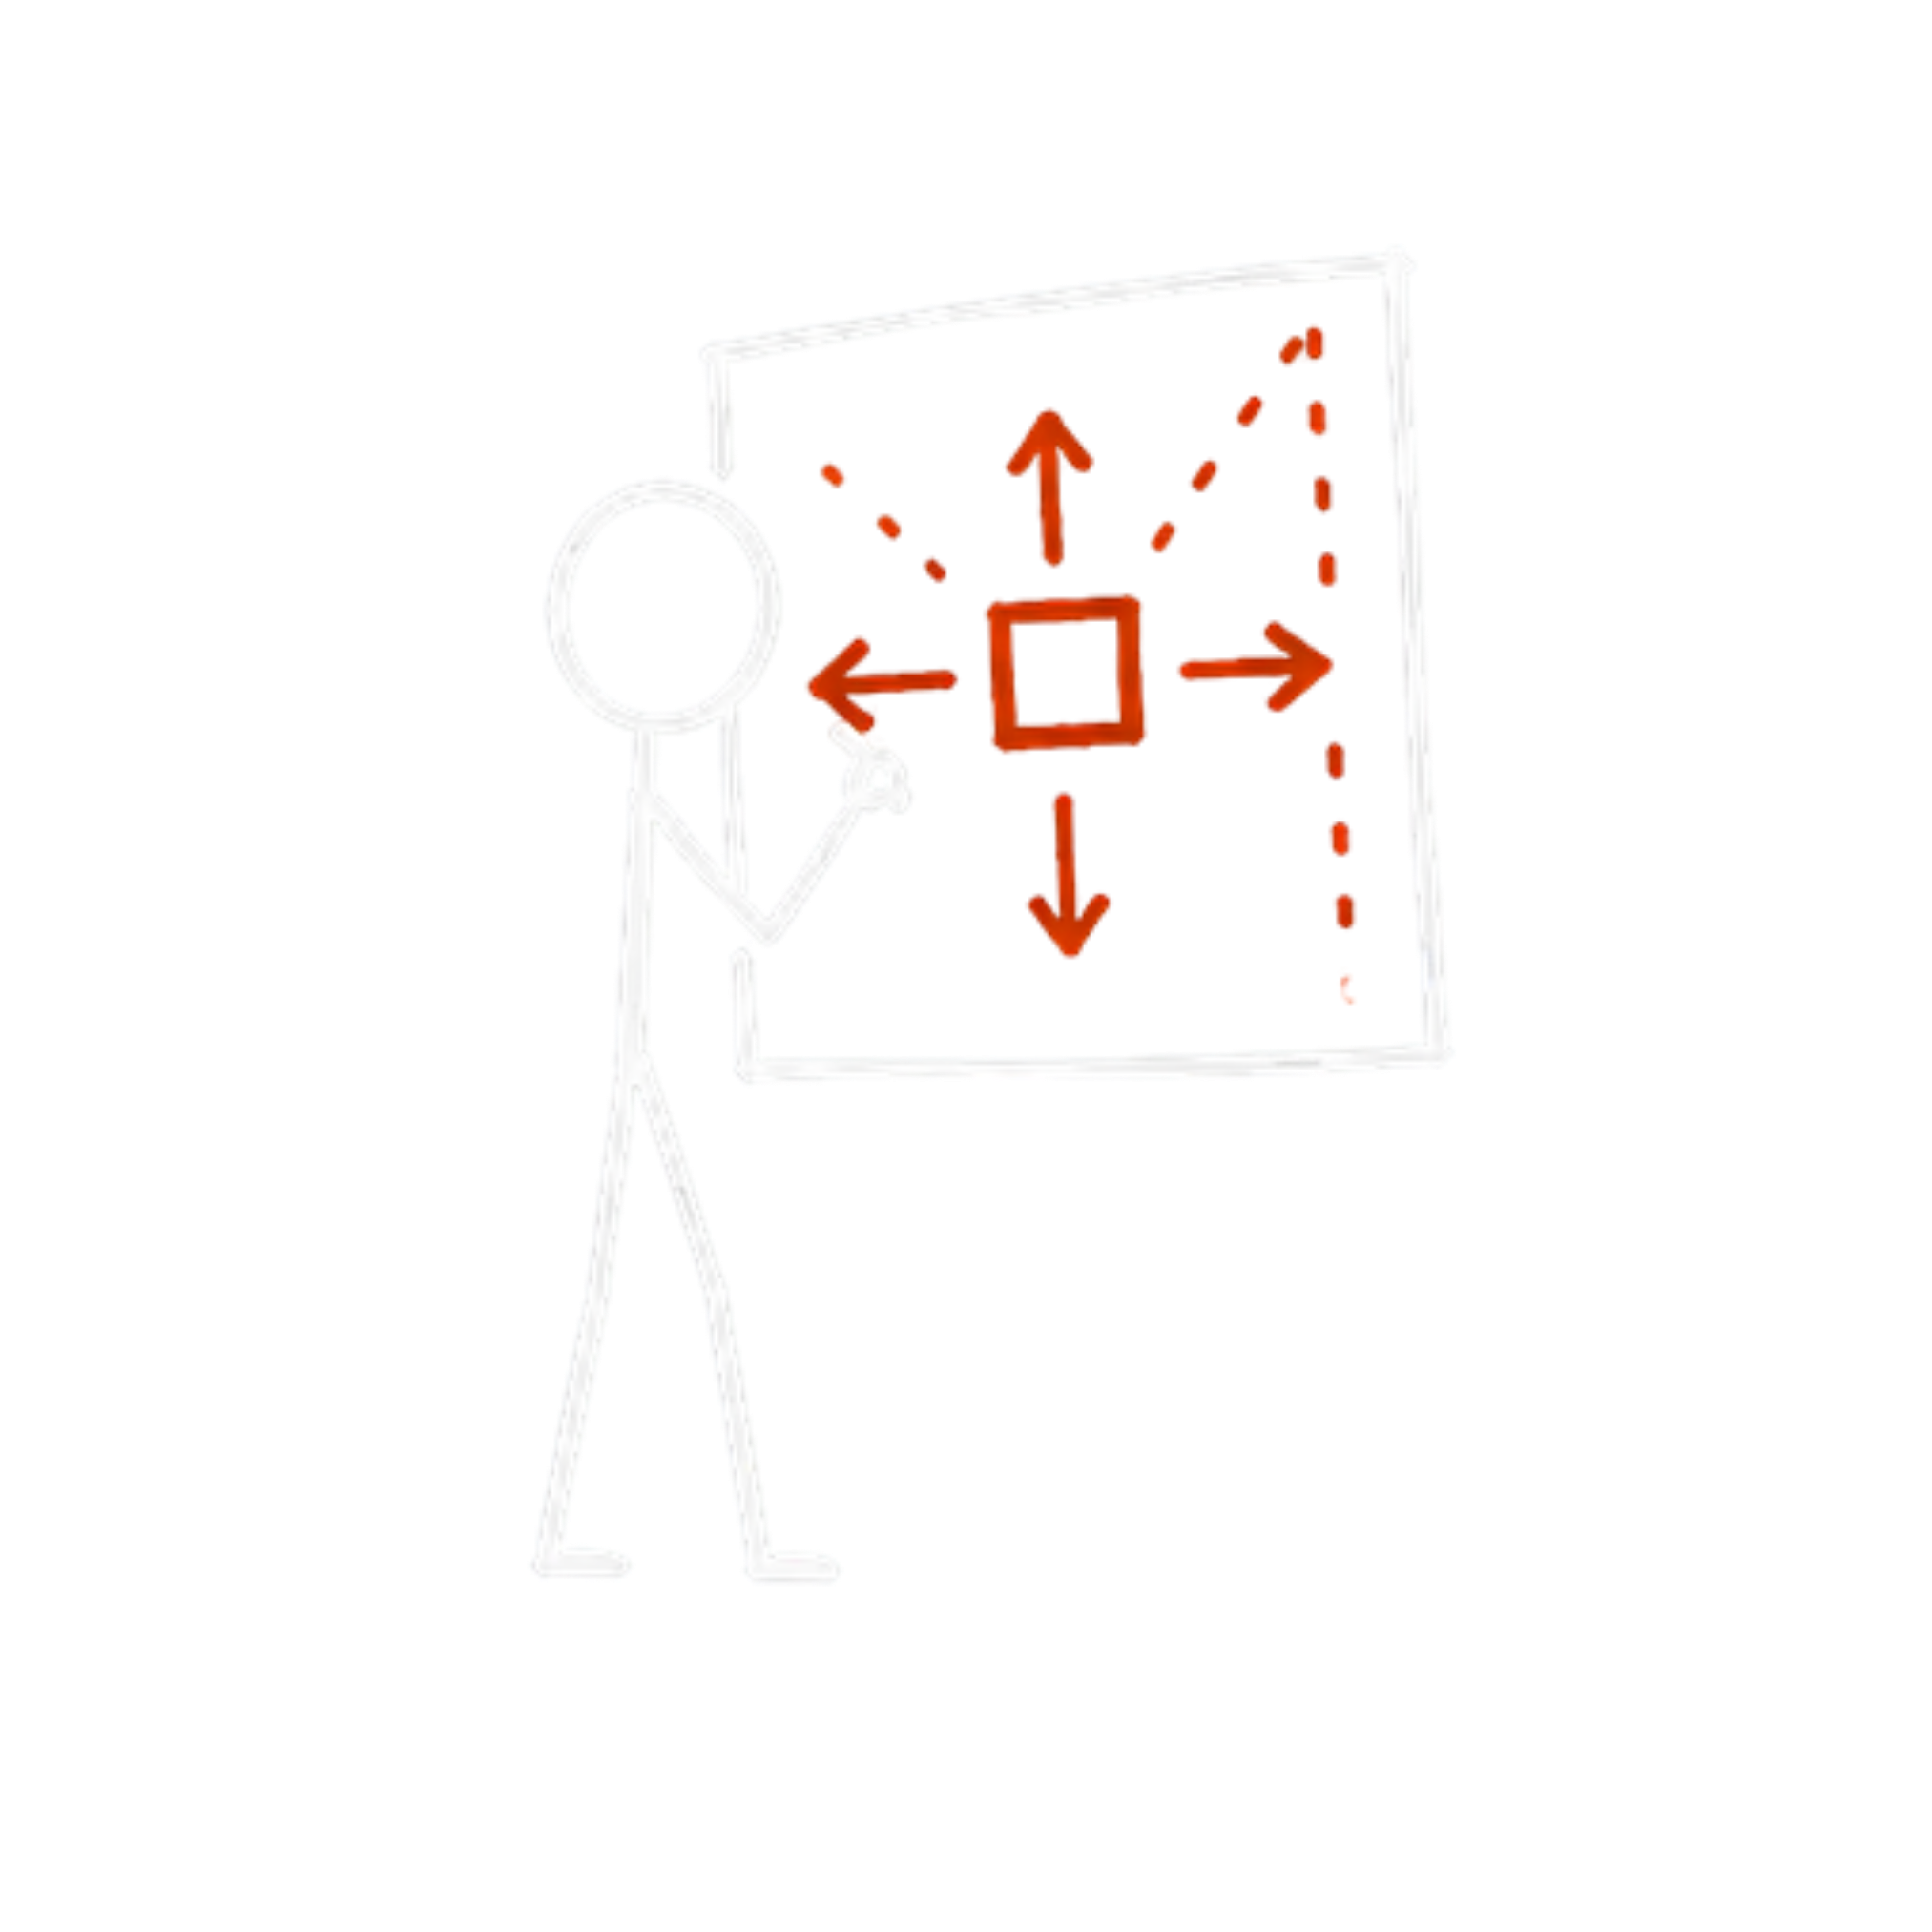
When leaders feel the gap, they reach for one of two things.

Consulting
Rigour and analysis, that stops at the surface. Change programmes sit on top of the organisation, unaware of the conditions producing the problem.

Coaching
Awareness and reflection, that are often disconnected from commercial reality and economic consequence.
Both have real value.
Neither measures the gap or connects it to results.
This is what makes us different.
We hold the economic focus of consulting and the systemic depth of coaching together, and translate the invisible into actionable terms for owners, boards and leaders.
01 | You request
Tell us a little about your company and agree the terms.


A simple exchange.

02 | We analyse
We prepare your outside-in analysis and review it before sending.
03 | We send
We send the analysis through within 48 hours of your booking.

04 | You feedback
You share your feedback on the report in a 30 min interview.

An early prototype.
This is a fresh and unique approach and we’re still proving it. Each analysis is built using our Meridian Framework, and uses both AI and human analysis to create an outside-in hypothesis.
While we’re in this prototype stage the analysis is free. In return we ask for thirty minutes of your honest reaction to what it surfaces for you, how you respond to it and if you find it helpful or useful. Your feedback will help us to learn, iterate and sharpen the work.

About us.

With more than thirty years across leadership, management, consultancy, coaching and advisory work, we have sat on every side of organisational change. We have run businesses, advised the people running them, and watched good companies lose ground long before it reached the numbers. Adaptiv exists to find that erosion while it is still early and less expensive to put right.
Amit Zala:
Founder
For most of my life I've been drawn to what lies beneath the surface of organisations, the hidden roots that shape everything we see above ground. Companies are living systems, and over almost two decades of diagnostics, coaching and systemic change work, its become clear to me that the entirety of company health is rarely a thing we measure. I built Adaptiv’s Meridian Framework to face into this gap, and make organisational health something you can see and read. My hope is simple: to help organisations see themselves clearly, and understand what they need to cultivate and what they need to confront, in order to improve growth quality and endurance.
Richard Tyler:
Associate Coach & Consultant
After a decade playing lead roles in the West End, including The Phantom of the Opera and Les Misérables, I founded BTFI in 2004. For twenty years since, I've worked on leadership and culture with JP Morgan, HSBC, John Lewis Partnership, the Co-op and the NHS, blending psychology and the arts. I wrote Jolt (Wiley) on shaking up how organisations think. I'm also a practising psychotherapist, trained in psychosynthesis, and certified in Barrett Values and systemic constellation coaching. In all that time I've rarely met a leadership team that didn't already know where its problem was. What they lacked was a way to name it that the business would take seriously — which is what Adaptiv provides. I coach, consult and co-design, starting at the point where a diagnosis has to become a conversation.
Luke Gray:
Commercial Finance Advisor
I'm CIMA qualified and have spent over twenty years in corporate finance across pharmaceuticals, private-equity backed businesses and early-stage companies. I've built financial models from scratch, run due diligence, and reported to boards and investors through the awkward stretch where a business is proving itself but not yet earning. In all that time, the numbers have reliably told me what happened and almost never why. Closing that gap is what Adaptiv is attempting, which is why I'm involved. My role is to keep the commercial model honest and make sure the economics stand up to the people who will interrogate them.

Kelly Tyler:
Strategic Advisor
I've spent two decades helping thought-leaders sharpen their positioning and turn what they know into something other people can actually use. That work now sits alongside my role as Social Impact Director at The Psychosynthesis Trust and as co-founder of The Willow Tree Foundation, a Wiltshire community interest company offering nature-based support to people living with cancer, grief and mental health difficulties. I think what Adaptiv is doing matters because we are in uncertain, changing times: new systems are emerging, and the culture and mindsets of organisations have to match them in order to thrive. Adaptiv offers measurable tools and holistic consultancy that enables transparent and sustainable change. My role is to press on the strategic direction and make sure the right people are in the room.
Rav Sawhney:
Organisational Psychology Advisor
I've always been fascinated by people, what drives us, and the often unseen dynamics that shape how we work, lead, and connect with one another. My background is an MSc in Organisational and Social Psychology and an MBA from INSEAD. I'm drawn to Adaptiv because I believe meaningful change begins with shared understanding and shared meaning. I hope to help individuals and organisations make sense of complexity, give language to what often goes unspoken, and create lasting change that feels authentic, human, and meaningful.

Alice May Slade:
Living Systems Advisor
I grew up on a smallholding in Wales, where my earliest memories are of nurturing animals and the land. With an MSc in Global Wildlife, Health and Conservation, I’ve spent twenty years in education and management roles in wildlife and conservation sanctuaries across Africa, Costa Rica, South East Asia and the UK. As a qualified teacher I privately tutor Environmental Science at A-Level and degree level. My experience enables me to ensure that Adaptiv’s Meridian Framework, and its underlying natural metaphor, adheres to the principles of natural living systems. I also provide environmental impact assessments and environmental consulting for Adaptiv’s clients.